Subscribe to our newsletter
Thanks you for subscription!
Oops! Something went wrong while submitting the form.


It takes nearly twelve minutes to start serving a 122 billion parameter MoE model1. on a B200 in Kubernetes2.
That's a long time.
First, measure.
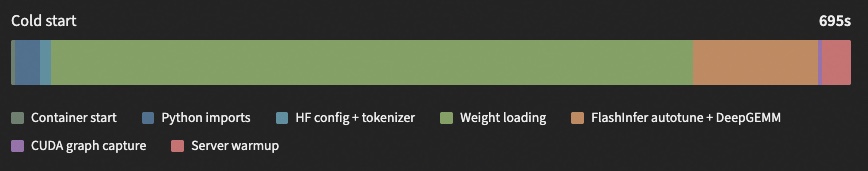
A lot of slow stuff! 21 seconds of python imports. Autotuning, JIT compilation. 531s of weight loading3! To be clear, this all makes sense with SGLang's API contract. SGLang getting 10% more tokens per second is worth way more than launching 10s faster. Over time, what happens is the launch time creeps up and up.
Most of this startup work produces artifacts that SGLang already knows how to cache. Compiled kernels, autotuned configs, JIT outputs. If we persist them across restarts1, we get a warm start:
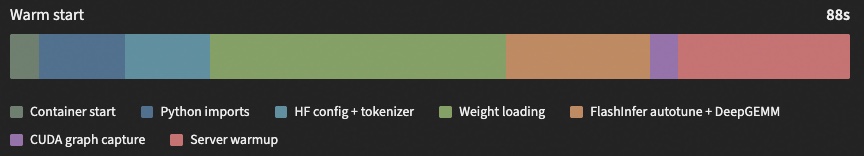
Much better. The kernel caches cut most of the compilation time, and the OS page cache does the rest. The weights are still on disk, but once they've been read once, Linux keeps them in RAM. Second load reads from page cache instead of NVMe.
We're still not doing great though. 88s! Only 31s of that is actually loading weights. The other 57s is imports, config parsing, autotuning, warmup. All overhead we're paying every time, even though the results are the same. The only irreducible part is moving 117 GB of weights onto the GPU.
On this machine we have PCIe gen 5 x16 (64 GB/s theoretical to GPU) and an NVMe gen4 SSD (7-8 GB/s to RAM). So the bandwidth floor for weight transfer is somewhere between 117/8≈15s117/8≈15s from disk and 117/64≈1.8s117/64≈1.8s from RAM. Can we get close?
One way to approach this problem is to take the timeline above and start hitting it with the optimization hammer. None of this stuff has to take this much time, and where it does need to take time, it could be cached, parallelised, pipelined.
It's hard though. SGLang is a big project, with a lot of moving parts. And the current structure is rational! We should take lots of time in startup to make sure we're being as performant as we can at runtime. We should expect that they will stay rational. If we make startup fast, it will later become slow again.
What we really want to do is just take everything that SGLang does on startup (including whatever they might choose to do in the future) and cache it, all together in some nice package that's fast to restore from. In the systems world this is called checkpoint/restore. The leading solution on Linux is CRIU, which can checkpoint and restore a process tree through existing kernel APIs. Its CUDA plugin calls NVIDIA's cuda-checkpoint tool to capture and restore GPU device state.
One catch: a naive CRIU checkpoint of SGLang would include all GPU memory, 192GB on our B200. Most of that is weights and KV cache that SGLang already knows how to reload. So we strip them out, shrinking the checkpoint from 192GB to 6.6GB, but we pay for it with a weight reload step on wake. Here's the restore timeline:
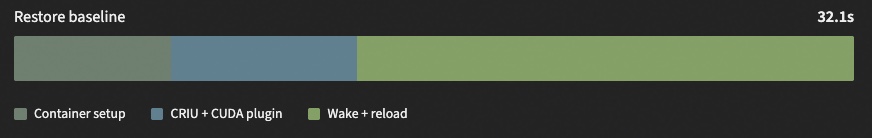
Lots better4! We've shaded over some frustrating work here: stripping weights and KV cache from the checkpoint2, packaging it as an OCI image for kubernetes3, GPU device remapping4, waking up after restore5, and getting CRIU and SGLang to play nice6.
32s, but still far from the bandwidth floor. Of the 32s, only 19s is actually loading weights. The other 13s is overhead: container setup (6s) and CRIU process restore (7s). Before we tackle the weight loading, we can cut this overhead roughly in half.
Containerd was doing redundant work on every checkpoint restore that it doesn't do on normal pod launches7. Two patches cut container setup from 6s to 3s. CRIU itself was also slower than it needed to be. The main fix is zero-copy page restore: mmap the checkpoint pages directly instead of copying them into fresh allocations8. After that, most of the remaining CRIU time is the cuda-checkpoint driver call itself.
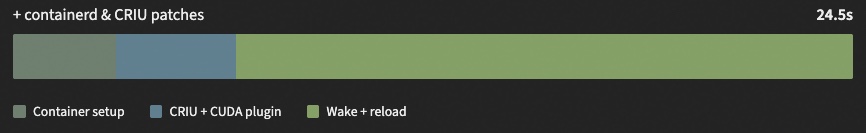
Overhead is down to about 6.5s. That leaves the weights.
It's finally time to tackle the big green bit. We've got lots of RAM on the device5, so the best we can do is PCIe bandwidth: 64GB/s for this machine setup. How are we going to get there?
First, the weight reload. We sneakily dropped it from 31s in the warm start to 19s in the restore baseline. Instead of loading from the safetensors files on disk (like on the initial load), on checkpoint we dump a serialized representation of the actual allocations6. Then, when we load back, we load through a ring buffer with direct IO. We hit the disk ceiling pretty handily for this device.
But the disk ceiling is is pretty low. We want the RAM ceiling: 1.8s. We can add faster disks, GPU Direct Storage, all this stuff. But if we don't want to re-spec our machine, and, like I do here, we've just got an NVMe-backed virtio disk, we need to get the weights into RAM before the restore starts.
The problem is, by definition, the process doesn't exist before it starts restoring. So it's going to have to get this RAM-backed weights file from someone else.
This 'someone else' is a daemon on the node, whose job is to watch the weights checkpoint directory and stage its contents into RAM. It exposes a unix socket to restored containers. On wake, torch_memory_saver queries the socket. If the daemon has the weights staged, it passes the file descriptor over and reload happens from RAM instead of disk. Otherwise, we fall back to regular restore. Depending on how much memory you give the daemon, the chance of a cache hit can be very high or very low7.
The remaining problem is getting 118GB from RAM to the GPU quickly. A naive cudaMemcpy from an unpinned buffer gets nowhere near PCIe speeds. You need the driver to know the buffer is stable in RAM, so it can issue DMA directly. But the registration call (cudaHostRegister) is slow, scaling with the number of pages backing the buffer. We solve this with hugepages (fewer pages to register) and by pipelining registration with the transfer8.
The net effect is big:
We're getting 38GB/s effective loading from RAM to the GPU. It's not 64GB/s (~50 GB/s is perhaps a more realistic expectation), but it's dead fast.
Here are all the reload paths on the same absolute scale:
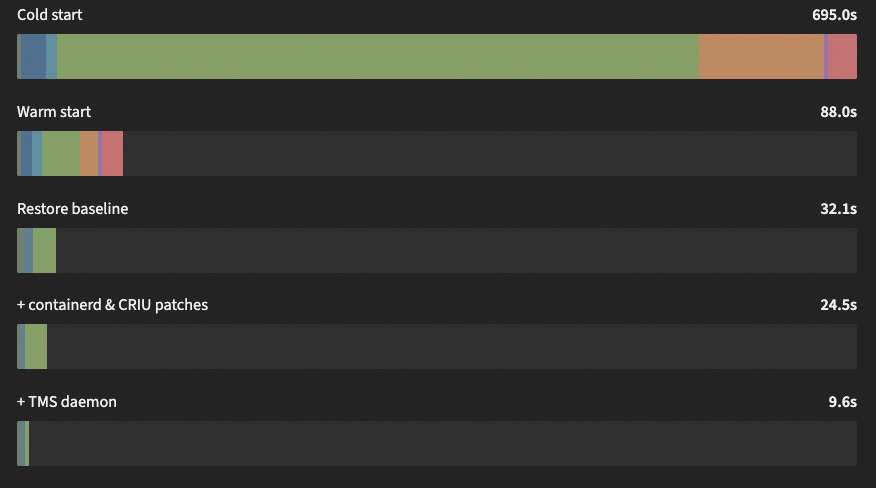
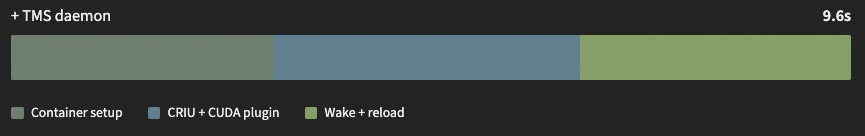
9.6s. 70x faster than cold, 9x faster than a warm start. Most of what's left is the cuda-checkpoint driver call (3.5s) and the weight DMA (3.1s at 38 GB/s). The theoretical floor is around 1.8s. We're not there yet, but we're getting close9.
echo 3 > /proc/sys/vm/drop_caches, clear all the kernel caches, then load from scratch. I thought this number was off, but it reproduces. It's a genuinely cold load, i.e. no page caching of the downloaded sglang image, no page caching of the downloaded model weights. You'd likely never see a start this cold except post-reboot.torch_memory_saver interposes SGLang's CUDA allocations via virtual memory APIs. It already supports backing weights to CPU during release_memory_occupation, but not to disk. We add a batched device-to-host transfer that writes a single flat file (doublewordai/torch_memory_saver#2). On reload, we just need to get the allocations back into their proper places. SGLang supports this weight reload via update_weights_from_disk, but 1. it requires reload from safetensors, which can be slow, and 2. The reload path for lots of models drifts from the original load path (its actually broken for this model).cudaHostRegister overhead kills the transfer benefit) but it really does seem to with hugepages. And apparently registration and copying don't serialize. I expected them to, otherwise why don't we just do this all the time instead of CPU bounce buffers. The consumer side is a short ceremony: open a Unix socket, receive the shared memory fd via SCM_RIGHTS, mmap it in-process, cudaHostRegister each 1 GiB span (pipelined with the H2D DMA), and copy to GPU. Operationally it's a DaemonSet that owns the hugepage reservation, and restored pods just mount the checkpoint directory plus the Unix socket (doublewordai/torch_memory_saver#3).

Teams use Doubleword to run low-cost, large-scale inference pipelines for async jobs.
Free credits available to get started.
